One of the riskiest assumptions for any new product or feature is that customers actually want it.
Although product leaders can propose numerous ‘lean’ methodologies to experiment inexpensively with new concepts before fully engineering them, anything short of launching a product or feature and monitoring its performance over time in the market is, by definition, not 100% accurate. That leaves us with a dangerously wide spectrum of user research strategies, and an even wider range of opinions for determining when customer feedback is actionable.
To the dismay of product teams desiring to ‘move fast and break things,’ their counterparts in data science and research advocate a slower, more traditional approach. These proponents of caution often emphasize an evaluation of statistical signals before considering customer insights valid enough to act upon.
This dynamic has meaningful ramifications. For those who care about making data-driven business decisions, the challenge that presents itself is: How do we adhere to rigorous scientific standards in a world that demands adaptability and agility to survive? Having frequently witnessed the back-and-forth between product teams and research groups, it is clear that there is no shortage of misconceptions and miscommunication between the two. Only a thorough analysis of some critical nuances in statistics and product management can help us bridge the gap.
Quantify risk tolerance
You’ve probably been on one end of an argument that cited a “statistically significant” finding to support a course of action. The problem is that statistical significance is often equated to having relevant and substantive results, but neither is necessarily the case.
Simply put, statistical significance exclusively refers to the level of confidence (measured from 0 to 1, or 0% to 100%) you have that the results you obtained from a given experiment are not due to chance. Statistical significance alone tells you nothing about the appropriateness of the confidence level selected nor the importance of the results.
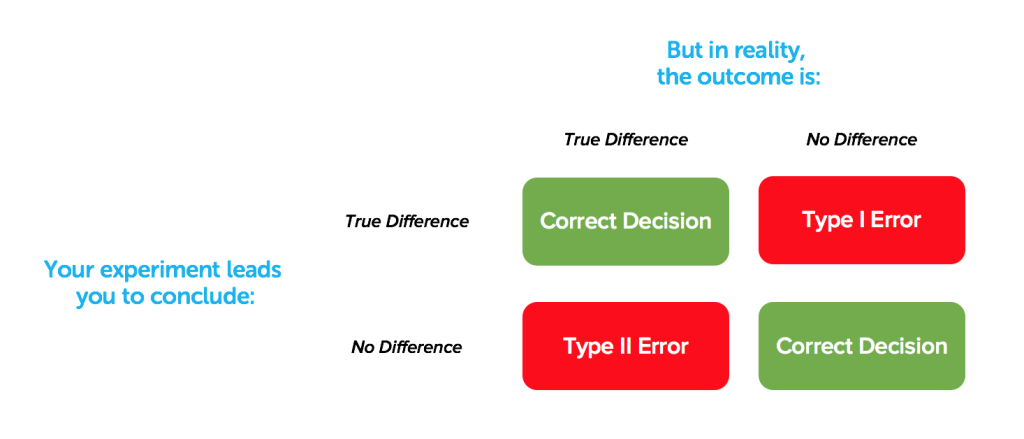
To begin, confidence levels should be context-dependent, and determining the appropriate confidence threshold is an oft-overlooked proposition that can have profound consequences. In statistics, confidence levels are closely linked to two concepts: type I and type II errors.
A type I error, or false-positive, refers to believing that a variable has an effect that it actually doesn’t.
Some industries, like pharmaceuticals and aeronautics, must be exceedingly cautious against false-positives. Medical researchers for example cannot afford to mistakenly think a drug has an intended benefit when in reality it does not. Side effects can be lethal so the FDA’s threshold for proof that a drug’s health benefits outweigh their known risks is intentionally onerous.
A type II error, or false-negative, has to do with the flip side of the coin: concluding that a variable doesn’t have an effect when it actually does.
Historically though, statistical significance has been primarily focused on avoiding false-positives (even if it means missing out on some likely opportunities) with the default confidence level at 95% for any finding to be considered actionable. The reality that this value was arbitrarily determined by scientists speaks more to their comfort level of being wrong than it does to its appropriateness in any given context. Unfortunately, this particular confidence level is used today by the vast majority of research teams at large organizations and remains generally unchallenged in contexts far different than the ones for which it was formulated.
But confidence levels should be representative of the amount of risk that an organization is willing to take to realize a potential opportunity. There are many reasons for product teams in particular to be more concerned with avoiding false-negatives than false-positives. Mistakenly missing an opportunity due to caution can have a more negative impact than building something no one really wants. Digital product teams don’t share many of the concerns of an aerospace engineering team and therefore need to calculate and quantify their own tolerance for risk.
To illustrate the ramifications that confidence levels can have on business decisions, consider this thought exercise. Imagine two companies, one with outrageously profitable 90% margins, and one with painfully narrow 5% margins. Suppose each of these businesses are considering a new line of business.
In the case of the high margin business, the amount of capital they have to risk to pursue the opportunity is dwarfed by the potential reward. If executives get even the weakest indication that the business might work they should pursue the new business line aggressively. In fact, waiting for perfect information before acting might be the difference between capturing a market and allowing a competitor to get there first.
In the case of the narrow margin business, however, the buffer before going into the red is so small that going after the new business line wouldn’t make sense with anything except the most definitive signal.
Although these two examples are obviously allegorical, they demonstrate the principle at hand. To work together effectively, research analysts and their commercially-driven counterparts should have a conversation around their organization’s particular level of comfort and to make statistical decisions accordingly.
Focus on impact
Confidence levels only tell half the story. They don’t address the magnitude to which the results of an experiment are meaningful to your business. Product teams need to combine the detection of an effect (i.e., the likelihood that there is an effect) with the size of that effect (i.e., the potential impact to the business), but this is often forgotten on the quest for the proverbial holy grail of statistical significance.
Many teams mistakenly focus energy and resources acting on statistically significant but inconsequential findings. A meta-analysis of hundreds of consumer behavior experiments sought to qualify how seriously effect sizes are considered when evaluating research results. They found that an astonishing three-quarters of the findings didn’t even bother reporting effect sizes “because of their small values” or because of “a general lack of interest in discovering the extent to which an effect is significant…”
This is troubling, because without considering effect size, there’s virtually no way to determine what opportunities are worth pursuing and in what order. Limited development resources prevent product teams from realistically tackling every single opportunity. Consider for example how the answer to this question, posed by a MECLABS data scientist, changes based on your perspective:
In terms of size, what does a 0.2% difference mean? For Amazon.com, that lift might mean an extra 2,000 sales and be worth a $100,000 investment…For a mom-and-pop Yahoo! store, that increase might just equate to an extra two sales and not be worth a $100 investment.
Unless you’re operating at a Google-esque scale for which an incremental lift in a conversion rate could result in literally millions of dollars in additional revenue, product teams should rely on statistics and research teams to help them prioritize the largest opportunities in front of them.
Sample size constraints
One of the most critical constraints on product teams that want to generate user insights is the ability to source users for experiments. With enough traffic, it’s certainly possible to generate a sample size large enough to pass traditional statistical requirements for a production split test. But it can be difficult to drive enough traffic to new product concepts, and it can also put a brand unnecessarily at risk, especially in heavily regulated industries. For product teams that can’t easily access or run tests in production environments, simulated environments offer a compelling alternative.
That leaves product teams stuck between a rock and a hard place. Simulated environments require standing user panels that can get expensive quickly, especially if research teams seek sample sizes in the hundreds or thousands. Unfortunately, strategies like these again overlook important nuances in statistics and place undue hardship on the user insight generation process.
A larger sample does not necessarily mean a better or more insightful sample. The objective of any sample is for it to be representative of the population of interest, so that conclusions about the sample can be extrapolated to the population. It’s assumed that the larger the sample, the more likely it is going to be representative of the population. But that’s not inherently true, especially if the sampling methodology is biased.
Years ago, a client fired an entire research team in the human resources department for making this assumption. The client sought to gather feedback about employee engagement and tasked this research team with distributing a survey to the entire company of more than 20,000 global employees. From a statistical significance standpoint, only 1,000 employees needed to take the survey for the research team to derive defensible insights.
Within hours after sending out the survey on a Tuesday morning, they had collected enough data and closed the survey. The problem was that only employees within a few timezones had completed the questionnaire with a solid third of the company being asleep, and therefore ignored, during collection.
Clearly, a large sample isn’t inherently representative of the population. To obtain a representative sample, product teams first need to clearly identify a target persona. This may seem obvious, but it’s often not explicitly done, creating quite a bit of miscommunication for researchers and other stakeholders. What one person may mean by a ‘frequent customer’ could mean something different entirely to another person.
After a persona is clearly identified, there are a few sampling techniques that one can follow, including probability sampling and nonprobability sampling techniques. A carefully-selected sample size of 100 may be considerably more representative of a target population than a thrown-together sample of 2,000.
Research teams may counter with the need to meet statistical assumptions that are necessary for conducting popular tests such as a t-test or Analysis of Variance (ANOVA). These types of tests assume a normal distribution, which generally occurs as a sample size increases. But statistics has a solution for when this assumption is violated and provides other options, such as non-parametric testing, which work well for small sample sizes.
In fact, the strongest argument left in favor of large sample sizes has already been discounted. Statisticians know that the larger the sample size, the easier it is to detect small effect sizes at a statistically significant level (digital product managers and marketers have become soberly aware that even a test comparing two identical versions can find a statistically significant difference between the two). But a focused product development process should be immune to this distraction because small effect sizes are of little concern. Not only that, but large effect sizes are almost as easily discovered in small samples as in large samples.
For example, suppose you want to test ideas to improve a form on your website that currently gets filled out by 10% of visitors. For simplicity’s sake, let’s use a confidence level of 95% to accept any changes. To identify just a 1% absolute increase to 11%, you’d need more than 12,000 users, according to Optimizely’s stats engine formula! If you were looking for a 5% absolute increase, you’d only need 223 users.
But depending on what you’re looking for, even that many users may not be needed, especially if conducting qualitative research. When identifying usability problems across your site, leading UX researchers have concluded that “elaborate usability tests are a waste of resources” because the overwhelming majority of usability issues are discovered with just five testers.
An emphasis on large sample sizes can be a red herring for product stakeholders. Organizations should not be misled away from the real objective of any sample, which is an accurate representation of the identified, target population. Research teams can help product teams identify necessary sample sizes and appropriate statistical tests to ensure that findings are indeed meaningful and cost-effectively attained.
Expand capacity for learning
It might sound like semantics, but data should not drive decision-making. Insights should. And there can be quite a gap between the two, especially when it comes to user insights.
In a recent talk on the topic of big data, Malcolm Gladwell argued that “data can tell us about the immediate environment of consumer attitudes, but it can’t tell us much about the context in which those attitudes were formed.” Essentially, statistics can be a powerful tool for obtaining and processing data, but it doesn’t have a monopoly on research.
Product teams can become obsessed with their Omniture and Optimizely dashboards, but there’s a lot of rich information that can’t be captured with these tools alone. There is simply no replacement for sitting down and talking with a user or customer. Open-ended feedback in particular can lead to insights that simply cannot be discovered by other means. The focus shouldn’t be on interviewing every single user though, but rather on finding a pattern or theme from the interviews you do conduct.
One of the core principles of the scientific method is the concept of replicability—that the results of any single experiment can be reproduced by another experiment. In product management, the importance of this principle cannot be overstated. You’ll presumably need any data from your research to hold true once you engineer the product or feature and release it to a user base, so reproducibility is an inherent requirement when it comes to collecting and acting on user insights.
We’ve far too often seen a product team wielding a single data point to defend a dubious intuition or pet project. But there are a number of factors that could and almost always do bias the results of a test without any intentional wrongdoing. Mistakenly asking a leading question or sourcing a user panel that doesn’t exactly represent your target customer can skew individual test results.
Similarly, and in digital product management especially, customer perceptions and trends evolve rapidly, further complicating data. Look no further than the handful of mobile operating systems which undergo yearly redesigns and updates, leading to constantly elevated user expectations. It’s perilously easy to imitate Homer Simpson’s lapse in thinking, “This year, I invested in pumpkins. They’ve been going up the whole month of October and I got a feeling they’re going to peak right around January. Then, bang! That’s when I’ll cash in.”
So how can product and research teams safely transition from data to insights? Fortunately, we believe statistics offers insight into the answer.
The central limit theorem is one of the foundational concepts taught in every introductory statistics class. It states that the distribution of averages tends to be Normal even when the distribution of the population from which the samples were taken is decidedly not Normal.
Put as simply as possible, the theorem acknowledges that individual samples will almost invariably be skewed, but offers statisticians a way to combine them to collectively generate valid data. Regardless of how confusing or complex the underlying data may be, by performing relatively simple individual experiments, the culminating result can cut through the noise.
This theorem provides a useful analogy for product management. To derive value from individual experiments and customer data points, product teams need to practice substantiation through iteration. Even if the results of any given experiment are skewed or outdated, they can be offset by a robust user research process that incorporates both quantitative and qualitative techniques across a variety of environments. The safeguard against pursuing insignificant findings, if you will, is to be mindful not to consider data to be an insight until a pattern has been rigorously established.
Divide no more
The moral of the story is that the nuances in statistics actually do matter. Dogmatically adopting textbook statistics can stifle an organization’s ability to innovate and operate competitively, but ignoring the value and perspective provided by statistics altogether can be similarly catastrophic. By understanding and appropriately applying the core tenets of statistics, product and research teams can begin with a framework for productive dialog about the risks they’re willing to take, the research methodologies they can efficiently but rigorously conduct, and the customer insights they’ll act upon.
I am soooo grateful for this clear, reference-full description of how research teams can avoid the ruts! Nicely said!
–indi
Before running out to set up a focus group or launch an online customer survey, you need to understand what your business goals are in gathering this data. Why are you gathering customer feedback? What will you do with it? Are you going to act on what you hear? When is the best time to approach your customers for feedback when they buy, when they don’t buy, when they’re using your product or some other time?