Executive Dashboards present an interesting array of design challenges ranging in all areas of user experience. Take your pick from a list that includes information and interaction design as well as information architecture. Add to that the business of creating information architecture that can provide a structure for growth and evolution. These challenges will be addressed in a six-part series over the next few months. The first article looks at problems facing dashboards which can be addressed by using a system of components that fit together to form a whole. Much like IKEA uses interchangeable islands, counters, and cupboards to create a custom kitchen, by using a system of tiles, it is possible to create an executive dashboard that effectively serves all its users.
The executive dashboard is a portal that combines business intelligence systems and browser-based applications to summarize the status of a complex enterprise for senior decision-makers. Like all portals, dashboards integrate a variety of content and functionality. Integration lowers the acquisition costs of finding items from multiple sources. It also increases the value of each individual tool and content asset through grouping to help decision-making and understanding.
But integration may also emphasize the differing, and sometimes conflicting, origins of the content, highlighting differences in the contexts, forms, and behaviors of dashboard offerings. The challenge is to create an effective user experience unifying these variations into a cohesive whole while preserving the meaning and identity of the individual assets. These challenges exist in all areas of user experience, from information design and interaction design to information architecture. Establishing sound information architecture capable of providing a consistent structure for growth and evolution for dashboards is particularly challenging.
Portlets: MIA (Missing Information Architecture)
The portal paradigm (collections of individual portlets in a single environment) is, so far, the most useful and familiar approach to these user experience challenges. I call it the “box of chocolates” model, because it packages a large number of different elements, while keeping each piece in its own compartment. The portal paradigm has two great strengths. First, it is a simple design approach, easily understood by users, business sponsors, and development teams. Second, it addresses many of the user experience design challenges associated with dashboards. It does this by breaking large collections of widely varying content into a series of well-defined and self-contained units. These units then present individual problems of information design and interaction design which can be solved one at a time, independently. It’s a classic divide-and-conquer strategy that is successful because it is so simple.
From the perspective of information architecture, however, depending on compartmentalization and self-containment is not a complete solution. In the short term, separating items in this way helps manage some of the user experience complexity. Over the long term, it results in two significant weaknesses.
First, self-contained portlets cannot be combined easily to address the need for larger and more flexible communication, beyond the single chunk of information. Portlets are a one-size-fits-all solution to the many-sizes-at-the-same-time problem. The goal of a dashboard is to synthesize disparate information, at multiple levels of granularity and size, into meaningful packages that can be shared among leaders, each with their own perspectives. Facilitating such communication is a primary purpose of most executive dashboards.
Second, portlets are inherently flat, or two-dimensional. Flat portlets alone cannot provide a scalable, adaptable framework for growth and change within a consistent information architecture. Two-dimensional portlets will work is cases where information architecture is not a challenge (i.e., when a dashboard shows a small set of critical key performance indicators or functions to a select audience on a single page or screen) But as the amount of content and functionality (hereafter referred to simply as “content”) grows, the number of portlets increases. This is often the case with many successful enterprise portals and executive dashboards. As word spreads about the usefulness of the dashboard, new audiences and users with differing information needs will join the early adopters, challenging the single view of the dashboard’s range of content offerings.
Dashboard teams may face issues of poorly integrated or conflicting content, reduced usability, navigability, and findability, and a poorer quality user experience. Portlets can only deal with unmanaged growth by sprawling horizontally. Though convenient in the short term, flat portlets lack the capability to provide useful and adaptable structure in the long term. Such horizontal sprawl is similar to the real world example of unmanaged residential growth around major cities – a pattern resulting in urban sprawl, traffic congestion, social isolation, and high ecological impact combined with low energy efficiency.
Escaping flatland
After encountering these weaknesses in a number of dashboards, I developed a simple set of information architecture building blocks to introduce depth and structure to flat dashboards. These building blocks allow for the rapid creation of larger units of content from smaller chunks of information, and support the goal of easily managed enterprise IA. The building blocks offer design teams modular information architecture components designed for assembly into larger combinations that scale effectively and respond to change. In the same way that you can create a unique but cost-effective kitchen from standard components such as cabinets, islands, fittings, and appliances, you can combine these building blocks to create an executive dashboard or enterprise portal that meets your particular needs.
The basic building block is a flexible component called a Tile. Tiles combine with other Tiles and building blocks to form larger, more complex units for content and functionality. Tiles and the other building blocks simplify the addition and removal of content, provide a basis for access and security controls at all levels, offer standard metadata attributes to simplify syndication and semantic issues, and make it possible for users to move about within the dashboard using consistent navigation flows. Together, the building blocks provide a sound information architecture for content required by business and a means of managing growth and change. Building blocks offer standardization, modularity, and interoperability at multiple levels of the information environment, as well as in the user experience.
Here’s an example of a complex dashboard designed with the building block system. The image shows a portion of a business intelligence dashboard displaying content related to products sold by the U.S. subsidiary of a global pharmaceuticals company. Many of the different building blocks appear in this single screen: a Section Connector, a Page Connector, a View, Control Bars, several varieties of Tiles, Utility Navigation, and Convenience Functionality. Present but not visible are common metadata, access definitions, and other infrastructure attributes. This screen illustrates several of the basic guidelines and principles of the building block system: openness, inheritance, independence, and layering. This screen also shows effective stacking of smaller building blocks. In this case, several Tiles are stacked within a View, which is itself part of a Page, to create a larger unit of content available for syndication to other enterprise systems.
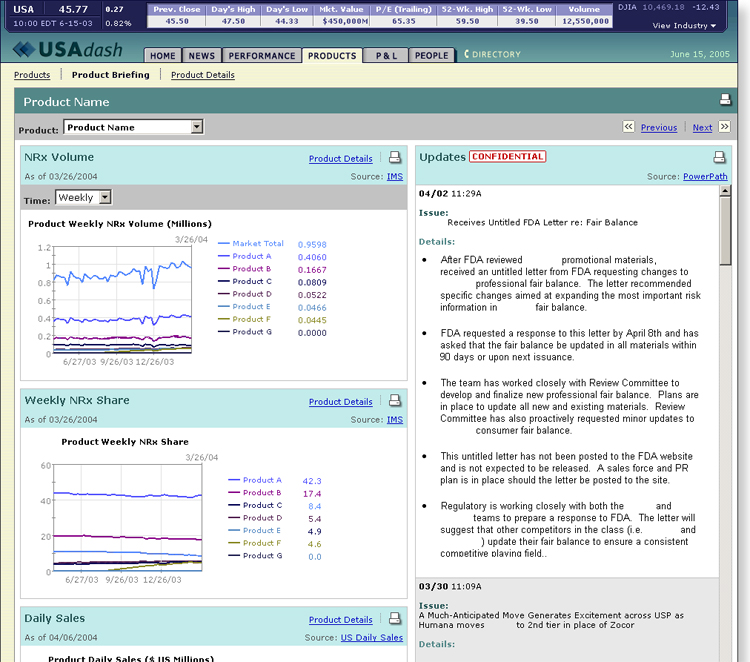
Figure 1: Example Dashboard Screen, Products Page (Click to enlarge.)
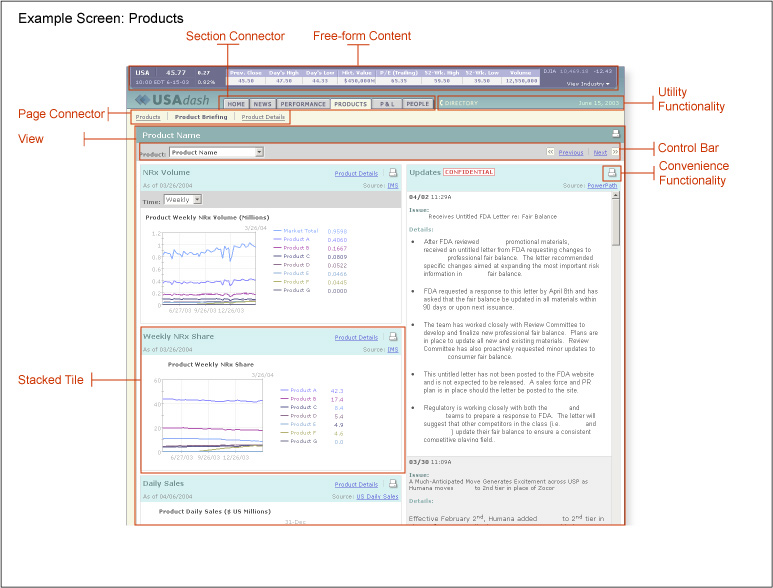
Figure 2: Dashboard Screen: This overlay outlines the individual building blocks that make up the Products page (Click to enlarge.)
A vision: syndicated assets for enterprise portals
The building blocks provide a strong foundation for the executive dashboard as an individualized console or executive information system. They allow the dashboard to offer different users a tailored subset of a larger pool of shared information and functionality assets.
This vision is based on a collection of building blocks for sharing and syndication: a Tile Library. Because the blocks represent standardization across many levels of the information environment, the Tile Library itself could take form at one or more of these levels. In enterprises lacking information infrastructure (such as a robust integrated enterprise applications layer or a strong semantic framework of enterprise metadata), the Tile Library might exist as a set of defined UX and IA blocks requiring custom technical design and system integration efforts. In enterprises with stronger, more mature information infrastructures, a Tile Library could take the form of a repository of building blocks users may access as services and assemble into new configurations labeled Dashboards, Enterprise Portals, or something else.
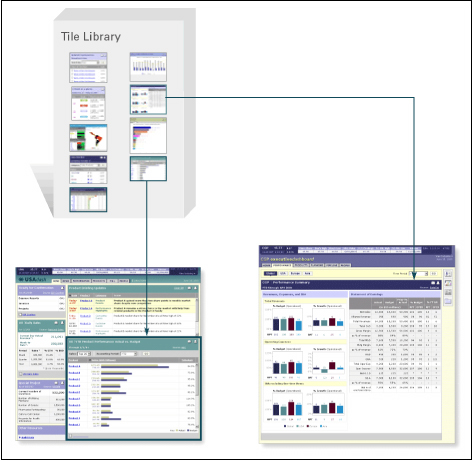
Figure 3: Tile Library
When used in environments with infrastructure capabilities such as single sign-on, distributed security and access management, discoverable web services, and integrated enterprise applications (EAI), this system of building blocks allows sharing and reuse of defined blocks among applications of all sizes and complexity. Widespread adoption and implementation of web services, XML, enterprise metadata, and enterprise security protocols make this both possible and practical.
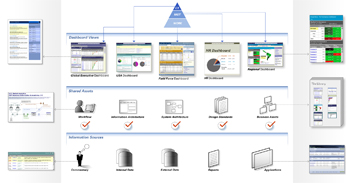
Figure 4: Vision: Shared Enterprise Assets / Tile Library
In this vision, the dashboard is the conduit through which a consumer can access and manipulate assets from a common library managed and governed as an enterprise resource. It is possible to imagine an integrated suite of dashboards relying on common architectures (information, user experience, and systems) and coordinated management or governance apparatuses working together to satisfy the needs of a diverse enterprise leadership.
This is the first in a series of articles about executive dashboards and portals. Part two will address, in detail, the use of Tiles as bulding blocks for an effective enterprise portal.
excellent article! i’m looking into using the dashboard approach for a project i’m working on now. i’ll be looking forward to your next series of articles covering this topic.
Thanks! The building blocks are useful for most tile-based design approaches, so if another type of portal better meets your needs, don’t think the blocks require thinking specifically in terms of a dashboard.
I’ve created a suggested – and *highly* original – tag for bookmarking items related to the building blocks: ia_building_blocks.
I’ve tagged a few items on del.icio.us – my default bookmarking service – but monitor tag streams from some of the other bookmarking services.
http://del.icio.us/tag/ia_building_blocks
Great article! This is a space that seriously needs some vendor-independent thinking, so I’m very much looking forward to the rest of the articles in the series…
Very interesting content.
Dasjboards design, when related to infovis methodlogies and techniques, could also offer new way to understand business trends and / or issues to be solved.
There is substantial merit in the idea of having a foundation technology useful for the construction of dashboards. I quite like the idea of having a coherent architecture from which dashboards can be rationally constructed.
However, the article misses the central point of dashboards, particularly executive dashboards: presenting enough information *in context* to provide a comprehensive analytic overview of the entire scope of the organization being examined.
To quote Edward Tufte, “Above all else, show the data.”
High quality analytic information design of a dashboard is the central factor leading to its success. In order to be effective dashboards must be information-dense and present the information clearly.
Practically speaking, this means that, as much as possible to “machinery” of the dashboard must give way to the information. The machinery must take second stage, to the point of fading completely away.
The article concentrates on the structural technical elements involved in dashboards, to the near-exclusion of good analytical information design. For example, Figure 2 labels 8 distinct structural elements but none of the data displays.
Illustrative of information design improvements that should be made in the sample dashboard…
The top two leftmost tiles show related measures for the same seven products in two line graphs covering the same time period. The As of date is the same for both and is shown four times. The product legend is duplicated, wasting precious space, as do the heavyweight title bars and non-data ornamentation.
It appears that the information in the graphs is possibly completely orthogonal in that the top graph show sales volume for each product, the bottom graph the proportion of total sales for each. This begs the question as to whether there is any additional information provided by the bottom graph. It’s hard to tell, but seems unlikely. (it would help if the graph were clearly labeled as % of total sales per product). If the second graph adds no additional information it should not be presented; if it does the presentation of the two graphs should be improved to convey their content and relationship more clearly.
An excellent resource for dashboard design is Stephen Few’s book “Information Dashboard Design The Effective Visual Communication of Data”, available from O’Reilly (http://www.oreilly.com/catalog/infodashboard/) and Amazon (http://www.amazon.com/Information-Dashboard-Design-Effective-Communication/dp/0596100167)
Chris – thanks for commenting. I’m afraid the purpose of the article may not have been clearly communicated, based on what I understand your comments to refer to. This article is the first in a series that shares a system of IA buliding blocks that is meant to be support a high quality user experience for presenting *any* kind of information / content / functionality, in an easily understood structure that can grow over time.
That means that the context for this article is the consistent set of design challenges teams must face when working on any dashboard, or tile based content aggregator. This design framework is meant to be independent of other contexts, such as industry or the functional role of the users.
Keep in mind that large organizations often need several kinds of dashboards or consoles, addressing diverse needs for information about the organziation at mulitple levels, and from multiple perspectives. Perhaps the specific label ‘executive dashboards’ leads away from the underlying idea of the building blocks – that one design toolkit can help solve many problems faced in the creation of a large range of tile-based experiences. In large organizations, a suite of interlocking dashboards is not uncommon; at the true exeuctive level, these consoles may be genuienly global in scope, but at lower levels of the organizational hierarchy, they may concern only a single region, product, or business unit.
Also be aware that the examples of dashboard screens and UI components are intended to show how to use the building blocks to design this sort of flexible structure, not to show proper information design for any specific set of content. As you’ve noticed, the examples show comps (or in some cases, sanitized screenshots from some of the ~25 actual dashboards built using this system of blocks) that emphasize the structure deliberately.
All that said, your points are valid. Context is essential for the proper understanding of information, and you’ll see some specific mechanisms built in to the buliding blocks that are intended to help preserve the context of information sourced from many different places. The structure should fade into the background and allow the information to be most prominent – thus the disclaimer that the renderings and exmaples here are not meant to be taken literally as design guidelines for any sort of dashboard, or tile-based experience.
Thanks,
Joe Lamantia
What stands out for me as useful in this article is your screen overlay. “Section Connector”, “Page Connector”, “Control Bar”, “Convenience Functionality” etc – these are really useful terms that I’m going to use going forward. Did you invent these or are they from something that I should read ? 🙂
Thanks Patrick – I’m glad you find them useful. The most important step toward sharing and discussing something is having a name for it, thus the joke that the first law of Information Architecture is “It’s all about labeling”…
As far as I know, these terms originate right here 🙂 But I haven’t done a thorough search for other examples. You might try some of the growing crop of books on portal and dashboard design available from various publishers to see what they have to say. These books were not available when I first developed the building blocks (now a while ago). Let us know what you find?
Great Article Joe. Very helpful for people like me starting with their first dashboard design projects. As Chris pointed out, Stephen Few has a good book on dashboard design and helps understand the cognitive science behind the layout, shapes and colors. However, it does not cover the design strategy that needs to be developed. Looking forward to read the remaining articles in the series and hope they are aligned with the theories from Edward Tufte and Stephen Few.
@Kiran: I’m compiling a list of related reading, to share as part of the series. I haven’t read Stephen Few’s book, but I’m looking forward to it. What other sorts of material would you recommend looking at?
Great Article Joe – I like the idea of tile library. Looking forward to read the remaining article in this series.
I am a student now, doing masters at TU Delft, before that I was designing dashboards for one of the big software company.
Having used a few dashboards over the years, I’d say the biggest challenge is not in their organisation (although that’s always a problem) but relevance of the data and whether or not its contextualised in a way that the user can act on.
Be that as it may, I’m intrigued by your articles on this. I’m trying to think of a way of designing a dashboard that was not based on some form of tile-like design, but I can’t. Is there anyone not doing this? I’m a bit confused.
@Jonathan: Sounds like the dashboards you experienced were exceptionally well-organized 🙂 Yes, relevance and proper contextualization are critical; so much so that they’re often some the first things that get attention during design. As information spaces grow over time – or grow very suddenly with mergers / acquisitions / reorganizations – the organization of the dashboard or portal frequently emerges as a substantial challenge. Anyone who’s done portal work can attest that these architectural and structural problems only increase with passing time.
What layer of the experience do you have in mind when you mention design? You’ve probably taken this to heart already, but I should mention that the building blocks are built to address quite a few layers of the dashboard environment at the same time. They do so by serving as a consistent conceptual framework – a framework that is very often rendered visually, even as it affects visible aspects of the portal experience such as screen layouts, navigation design design, content models, etc.. In other words, scratch the surface of any layer (visual, interaction design, information architecture) and you’ll find the building blocks showing through.
It’s difficult to think readily of dashboards that are not built on tiles. Perhaps something similar might be the business intelligence and reporting toolsets that allow direct manipulation of data sets and data feeds, in real time. But these are largely dedicated tools / applications, which do not provide additional functionality outside the BI / reporting category (so no social mechanisms for supporting discussion, analysis, and identification of consensus to drive decision making).
I’ve just noticed you’ve gone from having 1 reputation point on 2007/04/24 to 104 now! Congratulations! It’s taken me many years of hard fighting to get my 12…
I need to read your articles some more to get a better understanding of the finer points, I think. Right now, it seem to me a logical approach, but I’m not sure how close it is to what I’ve been doing for a while already.
@ Jonathan: I cashed in some air miles 🙂
In truth, I had several profiles active at the same time, including an older one that predated the reputation point system. Merging the various identities makes for some apparent strangeness in how the points are tallied. Overall, it’s a good lesson in how social mechanisms can make IT migration visible to customers in new ways…
Maybe you could share a bit about what you’ve been doing lately? That’s one way to kick off a conversation about whether the building blocks make sense for your needs.
I’m sure the rest of the community here would be interested – I know there’s need for examples.
hi Joe,
Read your article and it seems great. I am on to my very first dashboard design project and your article seems
impressive and helpful……… but my very first task seems to be a challenging one where I not only have to display content on my dashboard but even different verticals that are related to that content and in addition i need to display the control bar and the page selector things as well.
What would be your advice to me as to weather should i go with the tile principle or what…….
Kapil,
You can mix tiled content with untiled content, so it’s fine to address some of the challenges by relying on tiles, and some with other sorts of user experience paradigms. Examples of other experience paradigms could include web applications, hyperlinked information spaces, embedded applications, etc. Without knowing more about the nature of the problem, it’s tough to move beyond saying that it should be fine to create a hybrid solution that mixes elements from the Building Blocks, other tile-based approaches, and non-tiled paradigms as above. As long as the result works well for users, satisfies sponsors, and is ‘buildable’, consider it a success.
Perhaps you could post some of the designs you’re working on (somewhere besides B+A), and solicit feedback from the community. Specifics around a problem always help pull in suggestions from fellow designers. And who doesn’t like a good challenge to dig into?
Pretty good dashboards, really..
See also very nice dashboards here: http://perpetuumsoft.com/